Topic Name: Data Ecosystem with a Practical Data Set Example
Description: Data Ecosystem will be discussed, where an experimental data set example will be shown on how to Analyse and Clean Data.
This article presents the following questions:
What is a Data Ecosystem?
Why does Data Ecosystem so important?
Why is it necessary, and what things consider creating a Data Ecosystem?
What are the elements of a Data Ecosystem?
How do we create a Data Ecosystem?
What are the six steps of Data Cleaning?
Is data validation related to Machine Learning?
In this computerised era, any organisation’s data structure includes spreadsheets, databases, graphs, and charts, but they are small parts of the Data Ecosystem. Data Ecosystem refers to the various elements that interact with one another to produce, store, organise, manage, analyse, share, and act on data, and where we use different programming languages, general infrastructure, algorithms, and applications. Initially, these Ecosystems were directed to ITE, information technology environments, which remember us as Environmental Ecosystems. However, most prominent organisations create their own ecosystems that referred the technology stack, which includes a patchwork of software and hardware to collect, store, analyse, share, and act upon the data.
There is a question around here about why the data ecosystem is vital for the company. Literally, it is the backbone of data analytics. Data analysts, actuarial analysts, pricing analysts, and risk analysts work around this data ecosystem because this ecosystem delivers companies with data that helps them understand their customers and make better operations, pricing, and marketing decisions.
When creating a data ecosystem, three elements should be considered: infrastructure, applications, and analytics.
Infrastructure: The infrastructure is the foundation of a data ecosystem, as thinking a data ecosystem is a house. If ecosystems hold large data sets, teams can use technologies like SQL to segment their data, R, and Python, allowing faster queries.
Applications: When considering a data ecosystem as a house, applications are the walls and roof of the data ecosystem. Applications make the services and systems usable that act upon the data in the ecosystem.
Analytics: When a data ecosystem is a house, then analytics serve in the front door where teams access their data in that ecosystem house. For example, the analytics platform helps teams to make data analysis quicker by using searches and summarising the data in the data ecosystem.
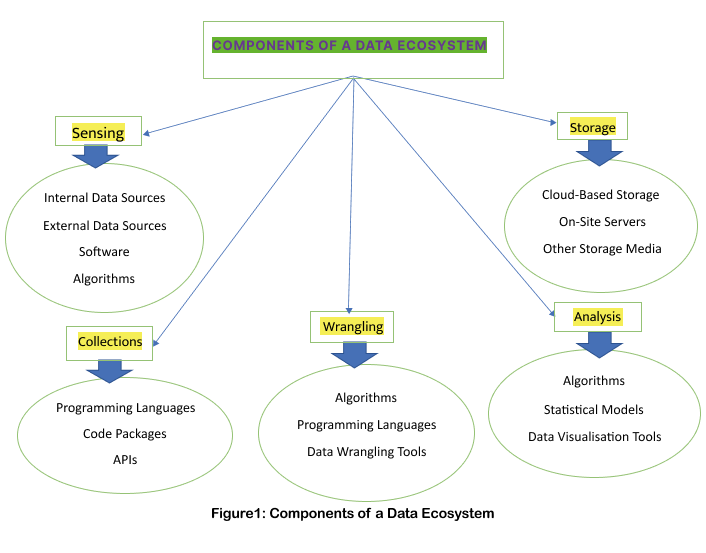
According to Harvard Business School, ” Data Science Principles, where the concept of the data ecosystem which is explored through the lens of essential stages in the data sets project life cycle: sensing, wrangling, analysis, collection, and storage“. I have shown that in the following Flow Chart:

It is noteworthy that Data Governance, Focus on Architecture, and Democratise Data Science are the most terms to consider when creating a data ecosystem.
The best ecosystems are built around a Data Analytics platform, and the data analytics, the science of data, team helps to combine multiple data sources (MDS), provide machine learning tools to automate the process of accomplishing analysis and track user cohorts so teams can calculate performance metrics. A few standard applications for analytics platforms are using machine learning to identify hidden relationships in the data, increase updated user engagement, send alerts to notify teams of changes, analyse individual users or cohorts, send messages to users directly, track conversions and trace marketing funnels, increasing user retention, A/B testing feature changes, and integrating with other applications in the data ecosystem.
The practical example submitted below is part of the discussed topic Data Ecosystem. I have attached a raw data file to work for here. The tasks are – to analyse data and clean data.
When looking at the attached raw data, it is evident that the components of the data have already been collected. So, the next step is to get the data ready for analysis. Since working with high-quality data will give the best result, it is crucial to clean the data. Therefore, it is necessary to do data cleaning and remove all duplicates, incorrect data, or irrelevant data.
This has been shown in the 2nd attached file- a clean data file (please get in touch with us for the attached data and references).
To clean the data, simple excel techniques and formulas were used. Here, the data file was saved from CSV to .xlsx format (Data sets also attached in this article), and six steps will follow in cleaning this data. The six steps are Step 1: Delete irrelevant data, Step 2: Remove deduplicates from data, Step 3: Fix any structural errors, Step 4: Deal with missing values or data, Step 5: Filter out the data outliers, and Step 6: Validate the data.
Firstly, a few columns were removed because they were irrelevant and not filled up, and I filled up the S/N. Secondly, duplicate values were checked by Conditional Formatting: Highlight Cells Rules: Duplicate Values, and Data: Remove Duplicates. It has shown on the screen as ‘How many duplicate values were found and removed; How many unique values remain’. Thirdly, there are structural errors in the date formatting by Home: date, whereas in British format for Data Created and Date Updated. Fourthly, deal with the missing values in the data and fix these ‘=TRIM(), and =if(L2=””, “00”, L2)‘ formulas were used. Next, some rows or columns could be removed to filter out the data outliers, but it still needs to be done as it is unnecessary now. Finally, the data can be validated because the data looks of high quality, properly formatted, and consistent. Artificial Intelligence, AL, and Machine Learning, ML tools can be used to check whether the data is validated.
NB: No data should be sharable or will be used for business purposes. All writings and images are reserved for the writer.


